By Robert Yeo, January 2022
Introduction
This article will explain how the optical performance of displays is quantified, and the instruments commonly used in display photometry and colorimetry will be presented. Parameters such as luminance, uniformity, contrast ratio, colour temperature and view angle will be reviewed, while the deleterious effects of ambient illumination and stray light will be explained.
Display Metrology
In display metrology, we are concerned with the optical performance of the device, or “how it looks”. This means we wish to know the brightness (or luminance) and also the colour (or colour temperature) as well as the range of colours that can be displayed (the colour gamut). We may wish to know how uniform the display is (and whether there are any defects or non-uniformities). We are also interested in the contrast ratio (the difference between the highest and lowest luminance that can be displayed) and also the view angle of the display.
Luminance (“Brightness”)
The most fundamental optical performance criteria for any type of display device (LCD, OLED, CRT or other) is the “brightness” – how bright the display is to the human observer. However in photometry, we don’t refer to the colloquial brightness of a display as such, instead the correct scientific parameter is called luminance. Luminance is defined as the amount of light emitted (or reflected) from a surface per unit area and per unit solid angle, as a human observer would perceive it.
The most fundamental optical performance criteria for any type of display device (LCD, OLED, CRT or other) is the “brightness” – how bright the display is to the human observer. However in photometry, we don’t refer to the colloquial brightness of a display as such, instead the correct scientific parameter is called luminance. Luminance is defined as the amount of light emitted (or reflected) from a surface per unit area and per unit solid angle, as a human observer would perceive it.
In radiometry, the absolute amount of light is measured in Watts, but because the human vision system has its own unique spectral sensitivity (known as the photopic response), we quantify the total light from a source in units of lumens. Therefore luminance is measured in units of lumens per square meter per steradian (the steradian being the unit of solid angle).
This is simplified to candelas per square meter (cd/m2) because a lumen per steradian is expressed in units of candelas. The geometry for luminance measurements is illustrated in Figure 1. The typical max. luminance for an LCD display is 500cd/m2.

Figure 1: Luminance is the amount of photopically-scaled light emitted or reflected from a surface per unit area per unit solid angle.
Colour & Colour Temperature
The colour or “white point” of a display requires that you measure the CIE chromaticity coordinates and compute the correlated colour temperature (CCT). In colorimetry, colour is quantified based upon the relative amounts of red, green and blue present, as perceived by the human vision system. With reference to the CIE tristimulus colour matching functions, we are able to record the tristimulus values (X, Y & Z) for the light emitted or reflected from the display. From these values, we then calculate the CIE chromaticity coordinates (Cx & Cy). For convenience, chromaticity coordinates can be presented in a two-dimensional chart known as the CIE colour space (Figure 2).

Figure 2: CIE 1931 chromaticity diagram showing Cx, Cy coordinate system and black body (Planckian) locus.
With approximately equal amounts of red, green and blue light present, the colour of light that we perceive is “white”. The exact shade of white light is of course still expressed using the xy chromaticity coordinate system, but for simplicity, we can reduce the colour of white light to a single number called the colour temperature or the correlated colour temperature (CCT). The colour of white light emitted by a theoretically perfect “black body” radiator follows the so-called Planckian locus within the CIE colour space diagram (the black line drawn within the shaded area in the colour space in Figure 2). As the absolute temperature rises, the hue changes and gradually transitions to more of a blue hue. The more red-tinted light (low colour temperature) is described as being “warm white”, while the more blue tinted light (higher colour temperature) is referred to as “cool white”. For sources that emit light with a colour temperature between 2,000 and 20,000 Kelvin, we define these as emitting white light, with the exact shade of white depending upon the actual absolute (Kelvin) temperature. With the exception of an incandescent lamp, all practical light sources do not conform to the theoretical ideal of a perfect black body radiator. For this reason, we define a modified parameter called the correlated colour temperature, abbreviated to CCT. The CCT of a white light source is the closest match on the Planckian locus to a theoretical black body. As such, it is a more approximate metric, but retains the advantage of allowing you to express the colour of white light using a single number (also in Kelvin).
The colour temperature of a candle is about 1,900 Kelvin, while that of a tungsten filament lamp is about 2,800 to 3,200 Kelvin. The colour of the sky varies with the zenith angle of the sun, from about 3,000 Kelvin at sunrise and sunset to about 6,500 Kelvin an midday.
Colour Gamut
The range of colours that a display can render is known as the colour gamut. The colour gamut of a display can be plotted in the CIE colour space diagram and will be drawn as a triangle, with the three vertices representing maximum red, green and blue. The closer to the edge of the colour space diagram the three vertices fall, the larger the contained area within the triangle and the greater the colour gamut. The more monochromatic the three primary colours of a display are, the closer to the edge of the colour space diagram the vertices fall. This helps explain why laser displays have the largest colour gamut (lasers are monochromatic light sources), while a traditional CRT display has the smallest gamut.
Display Uniformity
The uniformity of a display is also an important metric. Consider that consumer-grade LCD displays may be sold with several “dead” pixels but still be considered acceptable by most viewers. What constitutes a nonuniformity requires a complex analysis, however a lack of uniformity is defined as a localised difference in luminance. The uniformity of an LED backlit LCD panel is shown below for its white and black states (Figures 3 and 4).
Figure 3: LCD display in white state – some non-uniformities are visible.

Figure 4: LCD display in black state – non-uniformities are more apparent (note the backlight leakage along the lower edge).
Contrast Ratio and View Angle
The contrast ratio for a display is simply defined as being the ratio of measured luminance when the display is set to maximum white (bright state) compared to when it is set to maximum black (dark state). In the example shown below (Figure 5), the display is set to an alternating white/black chequerboard pattern. The white luminance of the display is 200 cd/m2 , while the black luminance is 2 cd/m2 . Hence the contrast ratio is 200/2 or 100:1.
The view angle of the display considers the maximum angle from the display normal that it can be viewed from at which point the contrast ratio drops to unity. At that angle, the luminance of the white is equal to the luminance of the black, so there is zero contrast. A typical LCD panel may be specified with a view angle of 170° (± 85°), however it should be noted that this is a questionable specification given that the projected display area at 85° from normal is tiny!

Figure 5: The contrast ratio for a display is the luminance of maximum white divided by the luminance of maximum black.

Figure 6: The reduced contrast ratio as the display is viewed from higher angles limits the view angle.
The Effect of Ambient Illumination
All of the aforementioned display metrics are normally evaluated in a darkened laboratory environment. Ambient illumination and stray light effects play no part in these tests. The display is then deployed in a vehicle or in a mobile device and guess what happens? You find that the display in unreadable in sunlight! Sunlight readability is a vital consideration in the design of a display, but how is this assessed? The important metric is the contrast ratio and how this is reduced by the effect of ambient illumination. The effective contrast ratio takes into account the effects of ambient illumination. Provided that the display surface has a greater than zero reflectance (which it will), the ambient light will reflect from the display and contribute to the luminance level that we see (and we measure). The summation of emissive luminance and reflected luminance will be disproportionally affected when the display is set to its minimum luminance state, hence the reduction in contrast ratio with ambient illumination.
Consider a display with a native contrast ratio of 1000:1 and a maximum (white) luminance of 450 cd/m2 . The display surface is assumed to be Lambertian (diffusely reflecting) with a reflectance factor of 0.05 (5%). With just 500 lux of ambient illumination (typical for a work place environment), we see that the contrast ratio drops from 1000:1 to just 86.6. At higher levels of ambient illumination (outdoors on a sunny day), this display would likely be unreadable. So managing the reflectance of the display is an important control that improves the sunlight readability of displays.
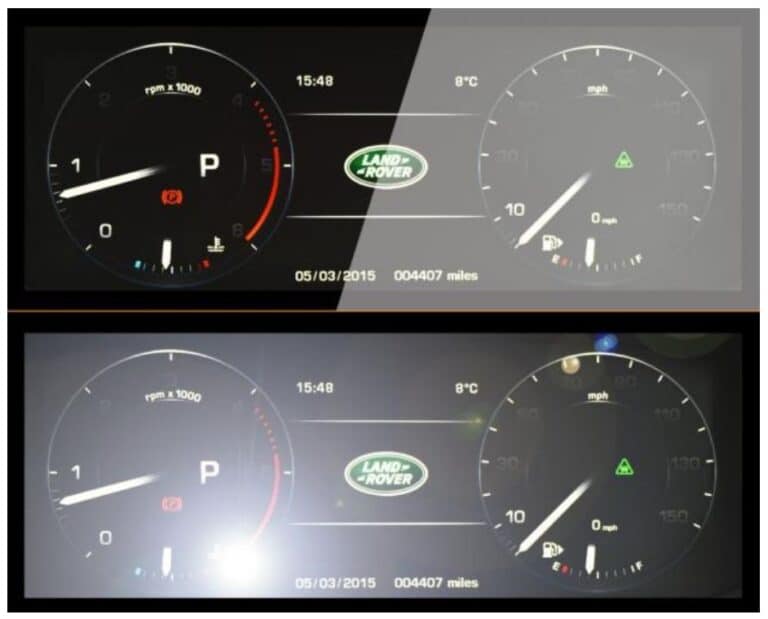
Figure 7: Ambient illumination and stray light greatly reduces the contrast ratio of a display and its sunlight readability.
Photometers for Display Measurements
The primary instrument used in display metrology is the photometer. Photometers are available for measuring luminous flux, luminous intensity and illuminance, but for display applications you need to use a dedicated luminance photometer. Luminance photometers (sometimes called “spot photometers”) are designed with field-of-view limiting optics that collect light from a small, defined area on the display (Figure 8). It is important to select a meter with a measurement spot size appropriate for the size of the object under test (Figure 9). This becomes vital when testing small lit areas on vehicle displays and controls. If the photometer collects light from both the lit area and the surrounding unlit area, the mean luminance recorded will be erroneously low (Figure 10).

Figure 8: A spot luminance photometer Konica Minolta

Figure 9: View through eyepiece of a spot photometer – you must align the small black spot on the object under test within the centre of the eyepiece FOV.

Figure 10: It is vital to align the measurement spot within the lit area of the luminance object under test. The correct luminance of this object (digits on a car speedometer) is 12.0 cm/m2 .
A luminance colorimeter operates in a similar manner to a luminance photometer, except that it records both the luminance as well as the chromaticity and colour temperature of the display. As an alternative to a colorimeter, a spot spectroradiometer provides a more precise match to the CIE tristimulus colour matching functions and hence a higher degree of accuracy with narrow spectrum and coloured light sources.
The next generation luminance photometer is based upon a CCD or CMOS 2D array sensor. The so-called “imaging photometer” (or imaging colorimeter) is not limited to measuring one small spot on a display at a time. Instead the luminance (or luminance and colour) is sampled at millions of points at the same time, and features are analysed in the recorded luminance image map through instrument software. This greatly simplifies the measurement of small lit objects such as vehicle switch packs, and also allows for the automatic
inspection of defects in flat panel displays (Figure 12). In addition, an imaging photometer can be equipped with a wide field-of-view “conoscopic” lens for measuring the view angle of a display.
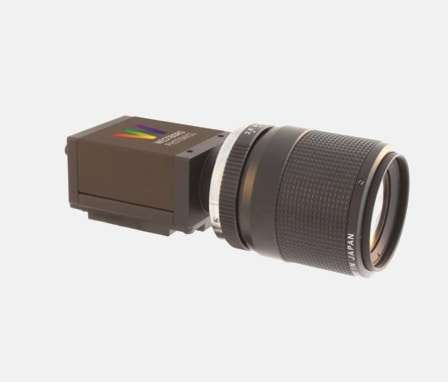
Figure 11: 2D imaging photometer (Westboro Photonics)

Figure 12: A false colour luminance map of the black-state
LCD panel shown above in Figure 4. This clearly reveals
luminance non-uniformities.
Further Information
Pro-Lite specialises in equipment for measuring light and the optical properties of materials and supplies light metrology equipment on behalf of manufacturers such as Labsphere, Konica Minolta, JETI, Avantes, SSL Resource and Westboro Photonics – Pro-Lite Light Metrology Equipment
In addition, Pro-Lite also provides training in photometry, light metrology and display measurements – Photometry Training Workshop