

By Russell Bailey, June 2024
Abstract
To properly characterise and calibrate imaging devices there are a wide range of tests that need to be performed to account for distortions caused by the sensor, the camera optics and filters.
Standards
There are a number of standards bodies and multiple standards from those bodies that define what image quality testing should be performed by manufacturers of imaging systems. These standards cover a wide range of industries from consumer electronics to automotive.
The heat island effect causes an appreciable difference in temperature, with the most current models finding that London is ~4.5ºC warmer than surrounding rural areas. In smaller towns and cities, this variation is 1-3ºC.
ISO: International Organization for Standardization
- ISO 12233 for photography and electronic still picture imaging, resolution and spatial frequency
- ISO 12232 for ISO, speed rating, standard output sensitivity, and recommended exposure index
- ISO 15739 for noise and dynamic range
- ISO 14524 for tone curve OECF standard
- ISO 17850 for geometric distortion
- ISO 17957 for uniformity/shading measurements
- ISO 18844 for flare
- ISO 19084 for chromatic displacement
- ISO 19567 for texture reproduction
- ISO TC 22 for road vehicles (SC 35: Lighting and Visibility)
- ISO 16505 for automotive side-mirror replacement systems
IEEE-SA: Institute of Electrical and Electronics Engineers Standards Association
- IEEE 1858 CPIQ: Camera Phone Image Quality – IEEE-SA Working group P1858
- IEEE P2020: Automotive System Quality Working Group
IEC: International Electrotechnical Commission
- IEC-62676 for video surveillance systems for use in security applications
EMVA: European Machine Vision Association
- EMVA-1288: Standard for Measurement and Presentation of Specifications for Machine Vision Sensors and Cameras.
- GeniCam: Standard Image acquisition interface supported by Imatest Image acquisition and acquire_image routine.
What Parameters Can We Test?
Chromatic Aberration
Lateral chromatic aberration (LCA), also known as lateral chromatic displacement or colour fringing, is a lens aberration that causes colour to focus at different distances from the centre of the image. This colour fringing is typically most noticeable at the edge of images. This effect is most noticeable in systems that use asymmetrical lens.
Correcting chromatic aberrations in images created by Bayer colour filter array sensors is complex. This is due to the pixels having twice as many green filters as red and blue images must be put through a software processing called demosaicing. Demosaicing is the process of converting images from one colour per pixel (either red, green or blue) to standard images that consist of three colours per pixel. It is very difficult to perform chromatic aberrations corrections following demosaicing, but this correction can usually be performed easily prior to demosaicing.
Lateral chromatic aberration can be measured using a range of standard targets and looking at the (mostly) tangential edges near the image boundaries.
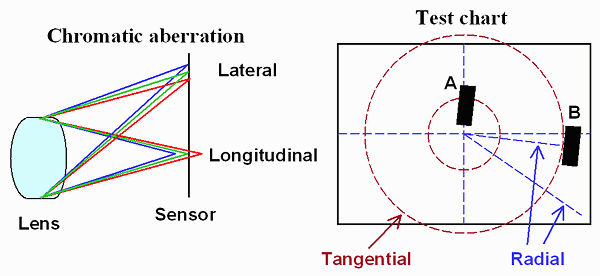
Figure 1: Chromatic aberration is caused by a combination of lens and detector.
Distortion
Distortion, also known as lens or optical distortion is an effect caused by optics in an imaging system that causes the image to curve at the edges of that image. This effect is problematic for metrological applications and architectural imagery as well as being unpleasant for non-technical images.
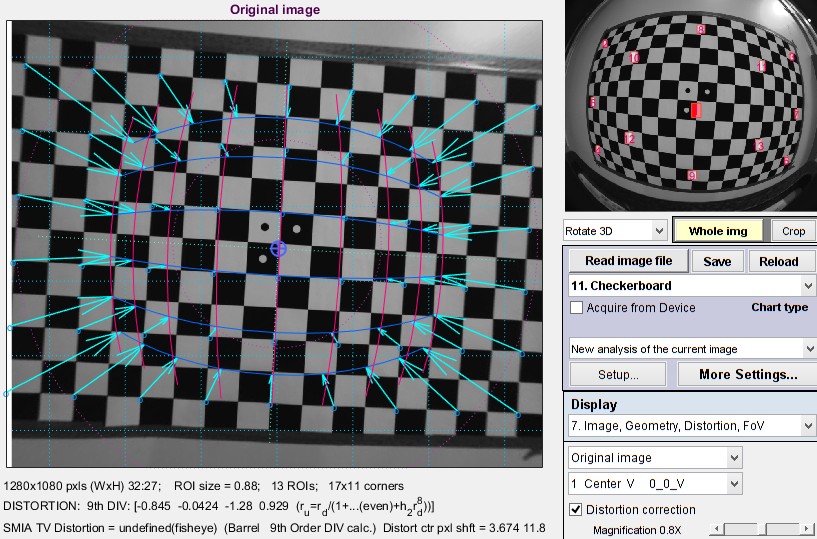
Figure 2: Corrected distortion caused by a fisheye lens.
Lens distortion is common in all optical systems and comes in one of two basic forms, barrel (where the curvature appears convex) and pincushion (where the curvature appears concave) distortion.
Distortion can be corrected using a checkerboard target, which can be reflective or transmissive. For wide angle ‘fisheye’ type lenses, there are targets distorted for the specific field of view.
Stray Light
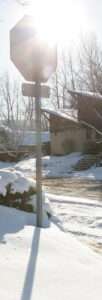 Stray light is any light that reaches the detector other than through the designed optical path of the system. It is caused by reflections, scattering and diffraction within the camera. Depending on the mechanism that causes the stray light it can appear as phantom objects in the scene (known as ghosting) or bright saturated regions (veiling glare).
Veiling glare in the optical system is caused by reflections between lens components within the inside of the lens. The effect on the image is described as a lens flare, which can appear as bright fogging on part of the image. Veiling glare is a major factor in limiting the system practical dynamic range.
There are two ways to measure stray light, either using a transmissive chart or a collimated point light source. Correcting stray light generally is done through redesigning the optics and the internals of the imaging system (using low reflectance materials or antireflection coatings to optics).
Sharpness
Sharpness is the property of an image that determines the amount of detail the image can reproduce. All optics cause blurring of an image to some degree so this is an important property to characterise.
System sharpness is caused by a range of factors including the lens (design and manufacturing quality, position in the image field, aperture, and focal length), sensor (pixel count and anti-aliasing filter), and signal processing (especially sharpening and noise reduction).
System sharpness is measured as a spatial frequency response (SFR), also known as the modulation transfer function (MTF). This is done by measuring optical targets with different size line pairs and determining the sharpness of the transition from the light to dark regions. The shorter the 10-90% rise distance, the higher the MTF (for that specific line pair).
Assessing MTF is limited by the sharpness of the target being used and the smallest size of line pairs measured. Typically, both front lit reflectance targets and back lit transmission targets can be used for this.
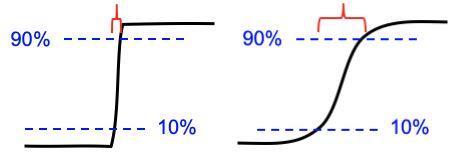

Figure 3: The transition between dark and light is quicker in sharper images.
Colour Accuracy
Colour (or color if you are American) accuracy is an important image quality factor for an application where exact reproduction of an image is important. For medical or technical applications, it can be vitally important to accurately reproduce a scene but in consumer applications we are often more concerned with ‘pleasing’ imagery rather than absolutely accurate colour replication.
Most imaging sensors are either grey scale (monochrome) or utilise a Bayer colour filter array (CFA), whereby each pixel has either a red, green or blue colour filter over the top. These Bayer CFAs are typically designed for colour reproduction so consist of twice as many green pixels compared to red and blue. There are also some specialised sensors consisting of clear grey scale pixels and red pixels designed for the automotive sector. Finally, some specialised metrology applications will utilise a grey scale sensor with an integrated filter wheel with filters either consisting of specific spectral band passes (known as a multispectral imager) or filters that are matched to the human visual response providing CIE 1931 tristimulus XYZ response (known as imaging colorimeters).
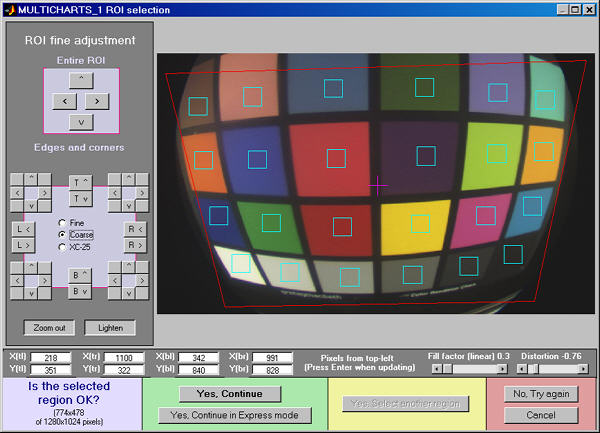
Figure 4: Colour assessment using a colour chart.
Bayer CFA sensors do not match the human visual response so to accurately reproduce coloured images, these sensors need to be calibrated and a colour correction matrix created. Colour correction is a somewhat laborious process because in order to accurately reproduce colours, the intended lighting conditions need to be replicated too. To the human eye, colours look vastly different in different lighting conditions. A blue car in sunlight might look much darker, almost black under street lighting.
Colour accuracy is typically tested using a reflective test chart illuminated uniformly from in front of the chart. To create a colour correction matrix you need to independently measure the illuminated targets with a spectroradiometer such as the Jeti Specbos 2501.
Aliasing and Colour Moiré
Aliasing in an imaging system occurs because all digital imaging systems have a maximum spatial frequency, known as the Nyquist frequency, beyond which scene information cannot be correctly reproduced. When the frequency of the signal being sampled is too high relative to the pixel frequency, this causes incorrect interpretation of the signal. This effect can cause artifacts such as jagged edges and colour moiré. It is especially prevalent in Bayer colour filter arrays due to the increased spacing between like pixels, especially in the blue and red.
Colour moiré is colour banding that appears in images with repetitive closely spaced patterns.
Colour moiré is tested using a reflective chart with hyperbolic wedges. It is possible to correct for aliasing effects by using optical filters (anti-aliasing or optical lowpass filters) which are designed to blur the image slightly, reducing the resolution a little to prevent these effects.
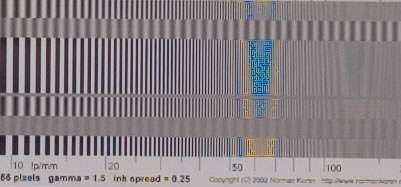
Figure 5: Narrowing line pairs cause aliasing in uncorrected images.
Noise
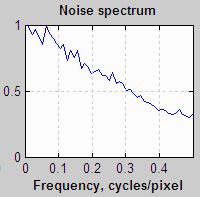
Noise is the random variation of brightness or colour variation in images. In image sensors, this is caused by thermal and photonic effects that manifest as electronic noise, low exposure and read noise.
Noise is caused by a number of factors, including the sensor technology used (CMOS for example is noisier than CCD), manufacturing process and pixel size. Sensors with larger pixels will have lower noise compared to sensors of the same type with smaller pixels. Small, high pixel density sensors used in consumer devices such as smart phones will typically suffer from noise issues especially at high ISO speed or low light environments.
Noise typically effects the clarity of the image to an observer but can be fixed somewhat with noise reduction software. This software noise reduction can cause problems with fine, low contrast detail so this correction treads a fine line.
There are a number of reflective and transmissive targets which can be used to characterise the noise and noise reduction in conjunction with other image quality factors.

Dynamic Range
Dynamic range is the property of sensors that defines how well the sensor can resolve bright and dark regions in an image. This is the range of exposure over which a camera system responds with sufficient contrast and signal to noise.
Typically, dynamic range is assessed for both a single exposure measurement and for a multi exposure, high dynamic range (HDR) measurement. For single image applications, HDR is often the most relevant measurement, but a huge range of applications (machine vision or security for example) will require video rates, so typically single exposure dynamic range testing is needed.
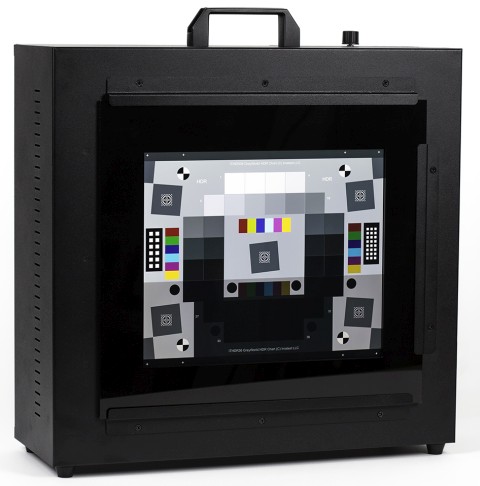
Figure 6: A light box with mounted transmissive target.
Dynamic range is tested using transmissive targets with a high uniformity lightbox. The targets consist of a range of squares, typically 32, with increasingly low transmission from 100% (OD0) to 0.0000032% (OD7.5) allowing analysis of up to 150dB dynamic range.
ISO Sensitivity and Exposure
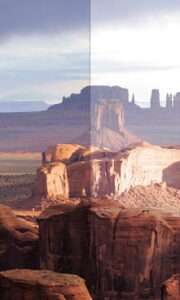
ISO Sensitivity is a measure of the response of an image sensor or system to light. The higher the sensitivity, the less light is required to capture a good quality image. There are several measures of sensitivity that are not consistent, known as saturation-based ISO sensitivity and standard output sensitivity.
Exposure is determined from the camera system sensitivity. The accuracy of this exposure isn’t a concern in manually adjustable cameras. Where the camera system has automated exposure, the exposure accuracy is vitally important to avoid over or under exposure.
Measurement of sensitivity and hence exposure is measured using step test charts, either transmissive or reflective.
Uniformity
Imaging systems suffer from non-uniformity due to several optical effects from both the lens system and the sensor. Lenses collect more light at the centre of the image due to the radial nature of the optics. The sensor itself has a reduced sensitivity as the angle of incidence on the detector increases. Similarly individual pixels have different responsivities compared to one another.
Uniformity needs to be characterised in both luminance (the brightness of the source) and colour as the effects that cause luminance non-uniformities can also distort the colour accuracy.
Uniformity is corrected by using a uniform light source, either a light box or more preferably an integrating sphere uniform light source. The uniformity correction is also known as a flat field correction. The higher the uniformity of the source the better the flat field correction.
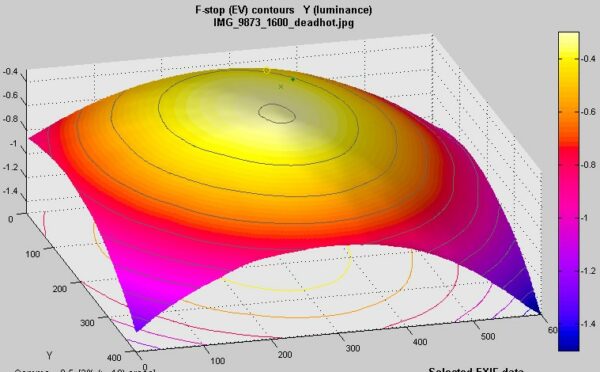
Figure 7: 2D contour image of an uncorrected imager viewing a uniform source.
Artifacts
Artifacts are caused by image processing algorithms. Almost all digital imaging systems utilise a selection of these image processing algorithms for correcting other issues. Generally, the image processing will improve measured performance, but may result in a degradation of perceived image quality. Noise reduction or sharpening for example can cause artifacts which cause blurring and loss of fine detail. Similarly, compression algorithms can lose data leading to pixelation and low contrast. Most of the sensor-based issues described can cause artifacts of some sort.
Image artifacts are typically analysed using dead leaves/spilled coins test charts.
Summary Table
This table summarises the image quality factors along with the type of chart and the module in the Imatest Master software that can perform that test.
Quality factor (KPI) | Test Chart | Imatest Test Module | Notes |
Blemishes, Sensor Defects | Plain, uniformly illuminated surface (flat field using uniform light source or light box) | Blemish Detect | Can be displayed on flat screen monitor with Screen Patterns and opal diffusing glass |
Colour Accuracy | ColorChecker (24-patch) | Colour/Tone Interactive, Colour/Tone Auto, Colourcheck | |
IT8.7 | |||
SFRplus and eSFR ISO multi-purpose charts | SFRplus, eSFR ISO | Best when used with a L*a*b* reference file (spectroradiometer measurement) | |
Dynamic Range (DR) | Grayscale step charts (linear and multi-row; primarily transmissive) | Colour/Tone Interactive, Colour/Tone Auto, Step Chart | Transmission charts are recommended for DR algorithm |
Reflective step charts (also works with transmissive charts) | Dynamic Range | Postprocessor for Stepchart and Colour/Tone. Calculates DR by combining several analyses at different exposures. Doesn’t require a transmissive chart | |
ISO 12233:2014 E-SFR | eSFR ISO | Measures ISO 15739 DR. Highly automated. Measures several IQ factors. | |
Exposure Accuracy | Step charts (reflective) | Colour/Tone Interactive, Colour/Tone, Step Chart | |
ColourChecker (24-patch) | |||
Information Capacity | Siemens star All slanted-edge charts | Star SFR, SFRplus, eSFR ISO, SFRreg, Checkerboard | Excellent figure of merit for cameras. Combines sharpness, noise, and artifacts. Measures signal and noise at same location |
ISO Sensitivity (closely related to Exposure Index) | Step charts | Step Chart | Two ISO sensitivity measurements are displayed when incident light (lux) is entered. Details in ISO Sensitivity and Exposure Index |
Various colour and step charts | Color/Tone Interactive, Color/Tone Auto | ||
SFRplus | SFRplus | ||
ColourChecker (24-patch) | Colour/Tone Interactive, Colour/Tone Auto, Colourcheck | ||
Lateral Chromatic Aberration | Slanted edge, ISO 12233 charts | SFR | |
SFRplus, ISO 12233:2014 E-SFR, Checkerboard | SFRplus, eSFR ISO, SFRreg, Checkerboard | ||
Dot pattern | Dot Pattern | ||
Lens Distortion | Square or rectangular grid or checkerboard | Distortion | Printable by Test Charts or displayed on LCD flat screen monitor with Screen Patterns |
SFRplus, ISO 12233:2014 E-SFR | SFRplus, eSFR ISO, Checkerboard | Highly automated. Measures several factors. Results in the Image & Geometry display | |
Dot pattern | Dot Pattern | ||
Light Falloff, Vignetting | Plain, uniformly illuminated surface | Light Falloff | Can be displayed on flat screen monitor with Screen Patterns. Opal diffusing glass recommended |
Noise | Step charts | Stepchart | |
ColourChecker (24-patch) | Colour/Tone Interactive, Colour/Tone Auto, Colourcheck | ||
SFRplus | SFRplus | Measures flat areas near slanted-edges. Best with low (4:1) contrast charts | |
eSFR ISO | eSFR ISO | Measures noise from grayscale surrounding center of chart. See Color/Tone Interactive/Color/Tone/eSFR ISO Noise | |
Wide variety of grayscale and colour charts | Colour/Tone Interactive | Works with a large variety of grayscale and color charts if patches are large enough. Can measure sensor (raw) noise. See Color/Tone Interactive/Color/Tone/eSFR ISO Noise | |
Sharpness (MTF) | Slanted-edge, ISO 12233 | SFR, Rescharts | ISO 12233:2000 and 2014 charts available for purchase. Edges printable by Test Charts. Algorithm |
SFR, SFRplus, eSFR ISO, SFRreg, Checkerboard | SFRplus, eSFR ISO, SFRreg, Checkerboard | Highly automated. Measures several factors. Available for purchase | |
Other charts: Star, Spilled Coins, Wedge, etc. | Rescharts, Star, Log F-C, Random, Wedge | Both interactive and fixed modules. Each responds differently to signal processing | |
Texture Detail | Log F-Contrast, Spilled Coins (Dead Leaves) | Log F-Contrast Random/Dead Leaves | |
Tonal Response (Contrast) | Grayscale step charts (reflective and transmissive) | Colour/Tone Interactive, Colour/Tone Auto, Stepchart | Includes a huge variety of charts. Color/Tone Interactive and Color/Tone are very versatile: recommended |
ColorChecker, IT8.7, Step Charts | Colour/Tone Interactive, Colour/Tone Auto | Color charts with gray scales for measuring tones | |
Multi-purpose charts: ISO 12233:2014 E-SFR, SFRplus | eSFR ISO, SFRplus | Measure several image quality factors along with tonal response | |
Veiling Glare (Lens Flare) | Reflective Q-13 or Q-14 step chart or plain white chart with “black hole” ISO 18844 | Stepchart, Flatfield (ISO 18844 measurement) | See Veiling Glare |
Colour Moiré (Aliasing) | Wedges in ISO 12233:2000 and eSFR ISO charts | eSFR ISO, Wedge | A color aliasing metric, derived from color moiré in wedges, has been added to Imatest 5.2. Color moiré is visible (but not measurable) in Log F-Contrast |
Software Artifacts | Log F-Contrast Any arbitrary image | Log F-Contrast SSIM | Notes [1,2] Can be simulated with Image Processing. SSIM measures degradation due to image processing (primarily compression) by comparing two images |
What Test Equipment is Required?
Image quality testing is usually conducted using a test chart and equipment to either directly illuminate or transmissivity illuminate that target. To properly analyse this, Imatest Master software has been designed with a range of standard test charts and quality factors for fast automated analysis.
Certain tests such as chromatic aberration and flare need test equipment specifically designed for those applications.
Detector quantum efficiency requires a scanning monochromator to spectrally scan across the wavelengths that the detector is sensitive to.
Image quality factor testing performed in the infrared (IR) domain (above 1µm) works on the same principle but requires specialist IR sources and more complex optical components. For IR sensor electro-optical infrared test equipment, Pro-Lite supplies SBIR systems.


