Radiometry & Photometry
By Robert Yeo, May 2022
Introduction
The science of measuring the amount, spectral and spatial distribution of light emitted by a source (light bulb, screen, infrared lamp etc.) is generally poorly understood. Few university-level physics or engineering syllabuses review the principles of optical radiation measurement, let alone the practicalities. This is despite our interacting with light almost constantly, both in nature and in our work and leisure activities. This paper will review the fundamental principles of light metrology.
Radiometry Versus Photometry
The science of optical radiation measurement can be divided into two types, depending upon whether the human observer is involved or not. When we view a light source or display, the brightness and colour that we perceive are a function of the characteristics of the source as scaled by the spectral sensitivity of the human vision system. The measurement of light sources as humans would perceive them is called photometry, and applies only to the visible light spectrum between 380 and 780nm.
Conversely, the measurement of sources of optical radiation, irrespective of the viewer, is called radiometry. Radiometry is the measurement of the absolute amount of optical radiation and applies to any wavelength between 100nm and 1000μm (Figure 1).

Figure 1: The Visible Light Spectrum as a Subset of the Electromagnetic Spectrum
The Human Visual Response: Photopic & Scotopic Vision
The human vision system does not perceive all wavelengths (or colours) as being equally bright. Wavelengths in the ultraviolet (UV) below 380nm are invisible to us, as are wavelengths in the infrared (IR) above 780nm. Between 380 and 780nm is the visible light spectrum, spanning colours from blue and green through to yellow, orange and red. Crucially, it is green/yellow colours that appear brightest to the human observer. For the same absolute (radiometric) amount of light, a green light at 555nm would appear at least ten times brighter than a red source at 650nm or a blue source at 450nm (Figure 2).

Figure 2: The Daylight Adapted Human Vision System Perceives Green Wavelengths as Being Brighter than Blues or Reds
The relationship between the wavelength of visible light and the perceived brightness is called the photopic response of the human eye. This is shown in Figure 3, the proper name being the CIE spectral luminous efficiency function for photopic vision. This was published by the Commission internationale de l’éclairage (CIE) in 1924.

Figure 3: CIE Luminous Efficiency Functions for Photopic and Scotopic Vision
Photopic vision applies when the human eye is daylight adapted, meaning that the light level is above a threshold level. This is defined in photometric terms as being an illuminance of at least 50 lux or a luminance of greater than 3 candelas per square meter (we’ll review units later in this paper). At lower levels of illuminance, two things happen. First, we gradually start to lose our ability to perceive colour. Second, the peak of our spectral sensitivity shifts to shorter wavelengths. At the point of full dark adaptation, our peak spectral sensitivity has dropped from 555nm for photopic vision down to 507nm. When the human eye is fully dark adapted, we exhibit scotopic vision, and this applies for illuminance levels below 0.05 lux or 0.01 candelas per square meter. The scotopic versus photopic response of the human eye is compared in Figure 3.
Scotopic (or dark adapted) vision provides no colour sensitivity, instead we only perceive shades of grey. The biological explanation for this is based upon the different light receptors located on the retina of the eye. Daylight adapted photopic vision is performed by the so-called cone receptors, whereas dark adapted scotopic vision relies upon rod receptors. The cone receptors responsible for photopic vision are capable of resolving between the three primary colours which are red, green and blue.
At light levels between full photopic and full scotopic, we refer to mesopic vision, whereby both cone and rod sensors on the retina are contributing to what we see. Almost without exception, the metrology of light sources is performed photometrically, meaning that the metrology equipment is engineered to mimic the daylight adapted, photopic spectral sensitivity of the human eye.
As mentioned earlier, as we shift from photopic to scotopic vision, blue tinted light starts to appear brighter. In other words, the more blue light contained in the spectrum of a light source, the better the illumination performance of that lamp will be at lower light levels. We can express the colour of white light using a metric called correlated colour temperature (CCT). An incandescent lamp emits white light with a CCT of about 2800 Kelvin, which we refer to as “warm white” due to the familiar yellow hue. By comparison, the colour of sunlight at midday is more blue tinted. We refer to this as “cool white” and the CCT will be about 6500K. The higher the CCT value, the more blue tinted the light source will appear.
The ratio of scotopic to photopic output of a lamp or other light source is termed the S/P ratio. The higher this number, the more blue light is contained in the spectrum of the lamp. The S/P ratio of common light sources is listed in Figure 4 below.
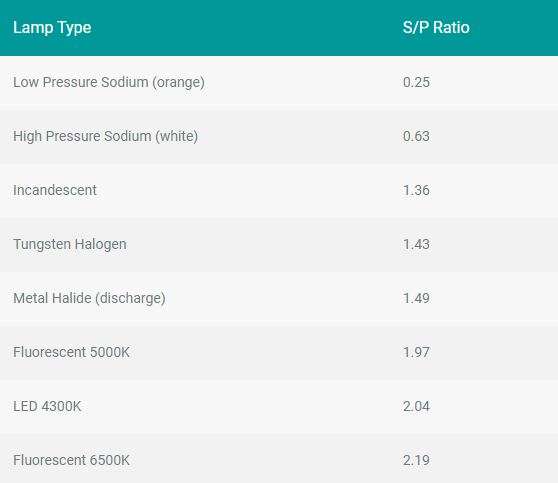
Figure 4: Comparison of S/P Ratios of Common Lamp Types
Comparing the S/P ratio of the historically prevalent low pressure sodium street lamp to a 4300 Kelvin colour temperature white LED, the latter will appear to be approximately 8 times (the ratio of 2.04/0.25) as bright to the fully dark adapted eye. Curiously, this property is exploited in few standards, the notable exception being the British Standard for street lighting, BS 5489. This standard recognises that at night the human eye will be to some extent dark adapted (i.e. in the mesopic zone) and therefore higher colour temperature lamps (those lamp types with higher S/P ratios) will produce a higher apparent illumination compared to lower colour temperature lamps with the same photopic performance. In turn, this allows lighting designers to reduce the number of lamps and lighting columns required to achieve the desired illuminance levels on the road surface, helping to save costs and promoting improved energy efficiency.
Returning to radiometry, any light source can be tested radiometrically, but if the application of the lamp involves viewing by a human, it is more relevant to perform a photometric measurement. Examples of radiometric measurements are of sunlight for horticultural purposes, or UV lamps used for germicidal disinfection or of an IR laser used for welding plastics. Examples of photometric measurements are of ceiling luminaires used to illuminate a home or workplace, of vehicle headlights or of a flat panel display used in a tablet computer. Radiometric measurements could be performed on these last three examples, but the values would not correlate with human visual perception. Hence we would only wish to perform photometric measurements on these types of products.
Photometric & Radiometric Quantities
There are four distinct geometric properties to consider when analysing the optical output of a lamp or other light source. These are: the total amount of light emitted; the amount of light shining in a particular direction from the light source; the amount of light reaching a surface; and the amount of light emitted per unit area of the light source. Let’s review each of these cases.
Total Flux
The total amount of light emitted from a lamp and propagating in all directions is termed the “flux” (as opposed to “power” – a distinction adopted to separate the optical output from the electricity consumed by a lamp). This is illustrated schematically in Figure 5.

Figure 5: The Total Light Emitted from a Lamp is Termed the Radiant or Luminous Flux

Figure 6: The Intensity from a Lamp is the Flux is a Specified Direction per Unit of Solid Angle

Figure 7: Illuminance & Irradiance are the Flux per Unit Area Falling on a Surface
Radiometrically, we define the parameter called radiant flux, which is measured in units of Watts (W). Photometrically, we refer to luminous flux, which is measured in units of lumens (lm). Note the use of the capital “W” in Watt, as the unit derives from a person’s name (in this case, the Scottish engineer James Watt). It is believed that the name “lumen” was coined by the French physicist Blondel in 1897, as the unit of what he termed “luminosity”, which derives from the Latin meaning “light”.
From the CIE luminous efficiency function for photopic vision, we can determine that a monochromatic lamp having a radiant flux of 1 Watt at a wavelength of 555nm would possess a luminous flux of 683 lumens.
When measuring lamps, we will come across reference to 2π and 4π flux measurements. This nomenclature refers to the measurement of the radiant or luminous flux over a hemisphere (2π steradians) or the complete sphere of emission (4π steradians). The steradian is the unit of solid angle. To illustrate the difference, consider that the total light output of an incandescent lamp would be collected in all directions (4π flux), whereas an LED spotlight is highly directional, so it would be reasonable to test just the forward flux (2π).
Directional Intensity
A possibly more useful metric than total flux is the directional intensity from a lamp, defined as the amount of flux propagating in a defined direction per unit of solid angle. The direction is important as few (if any) light sources are truly isotopic (emitting the same intensity in all directions). Radiometrically we refer to radiant intensity, while photometrically the parameter is called luminous intensity (see Figure 6).
The unit of radiant intensity is Watts per steradian (W/sr). Photometrically, we can report luminous intensity in units of lumens per steradian (lm/sr) but this is simplified to the candela (cd), with a lumen per steradian equal to one candela. The integral of directional intensity over 2π or 4π steradians is of course the total flux from the light source.
Concentrating the flux from a lamp into a narrow cone of light results in higher intensity values. This phenomenon is exploited in high power torches where claims of “one million candle power” (i.e. candelas) are sometimes made.
The intensity from a lamp doesn’t vary with the distance from the light source, provided that you view the lamp from what is called the “far-field”. In the far-field, the light source behaves as if it is a point emitter of light and the beam propagates with constant intensity. Conversely, as you move closer to the lamp you enter the “near-field”, in which the physical extent of the light source begins to have an effect and the intensity changes. Measurements of near-field intensity tend to be avoided, and instead a different parameter is more commonly measured – the luminance or radiance. More on this shortly.
Illuminance & Irradiance
The amount of flux falling on a surface per unit area from a lamp or light source (see Figure 7) is called the irradiance (radiometric) or illuminance (photometric). The units of irradiance are Watts per square meter (W/m2), while for illuminance we can use lumens per square meter (lm/m2) but this is simplified to lux (lx), with one lux equal to one lumen per square meter.
Except for a perfectly collimated beam from a laser, the rays of light from all other sources spread out as the beam propagates. As a consequence, illuminance and irradiance vary with distance between the source and receiver. Therefore, when specifying illuminance and irradiance values, it is vital to also state the measurement distance.
The definition given previously whereby the intensity from a lamp remains constant in the far-field can also be expressed in terms of the illuminance/irradiance varying with the square of the distance between source and receiver. For the case of a point source of light, the illuminance/irradiance decreases with the square of the increase in separation between the lamp and the measurement plane. A useful relationship between intensity and illuminance and irradiance for a point source of light was developed by French mathematician Pierre Bouguer. This is known as the inverse squared rule and is illustrated in Figure 8. It states that: I=E/x2
where Intensity (I) is equal to the irradiance (E) divided by the square of distance in meters between source and receiver (x). The utility of the inverse squared relationship is that it allows you to determine the intensity of a lamp and compute the illuminance or irradiance at any distance, provided you are in the far-field for that lamp.
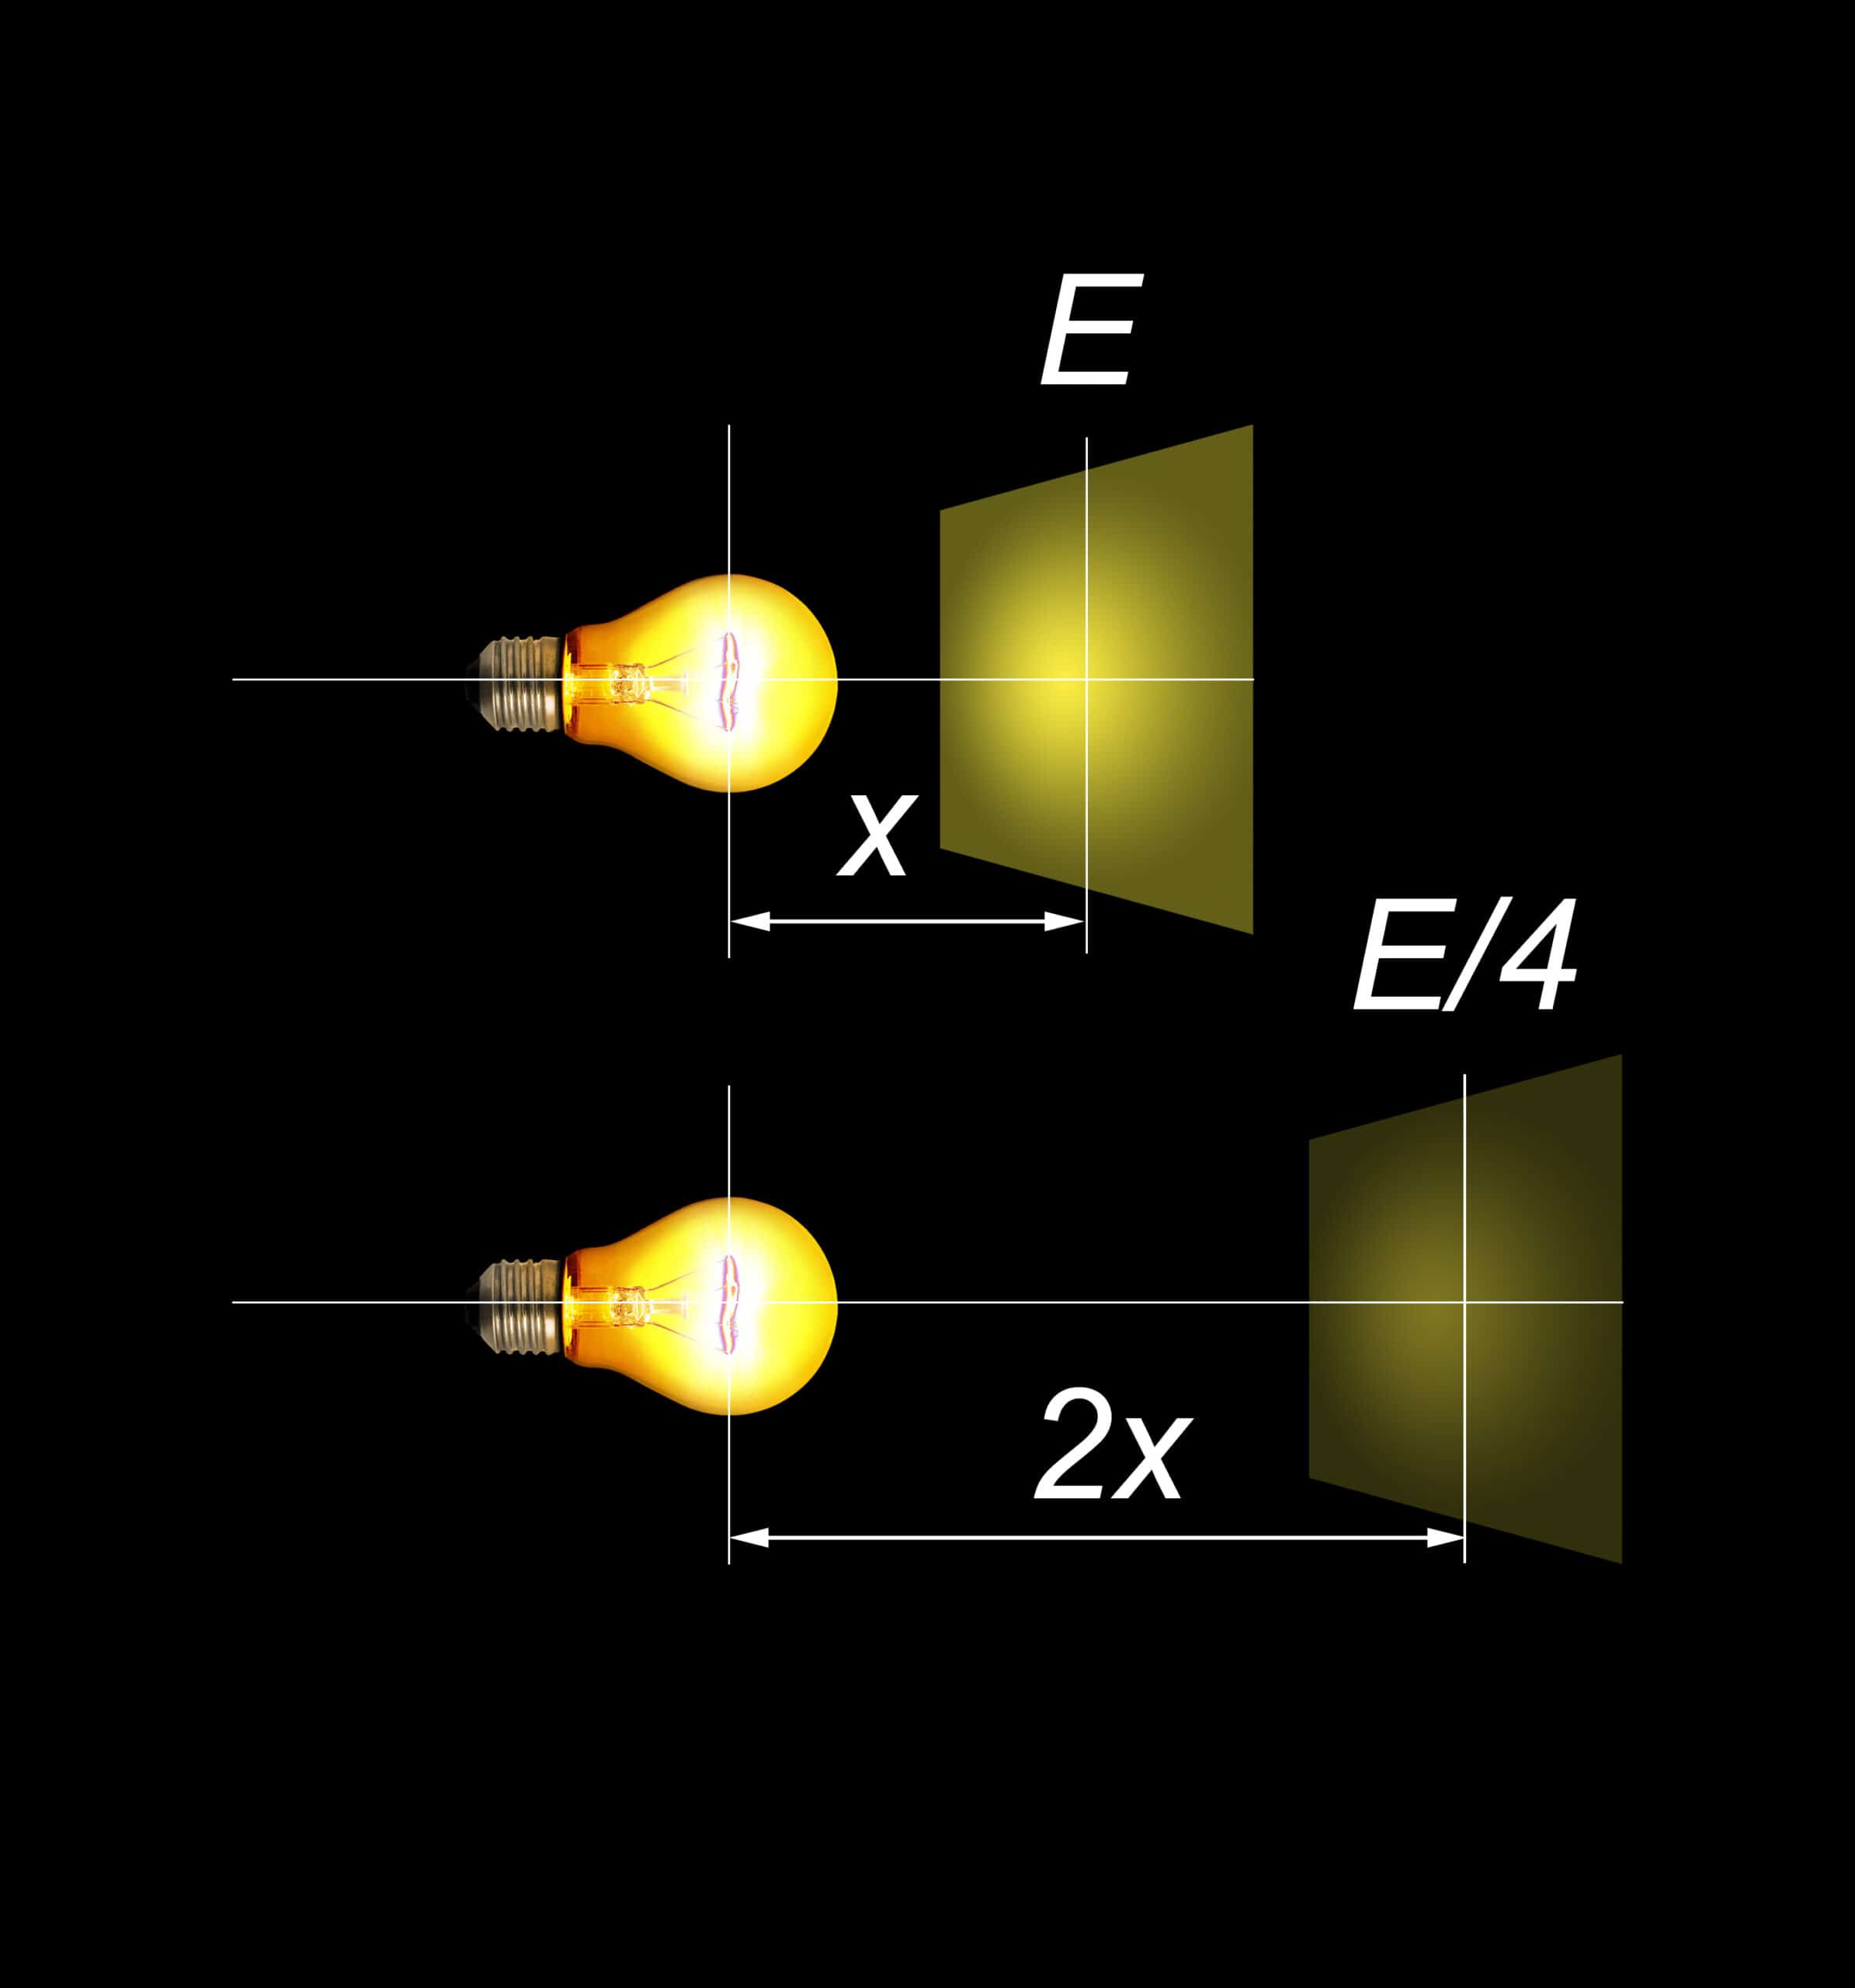
Figure 8: The Inverse Squared Rule for Illuminance & Irradiance in the Far-Field
When considering irradiance or illuminance, what if the surface being illuminated is not at normal incidence to the direction of illumination? In that case, the illuminance/irradiance decreases, following the cosine relationship first proposed by the Swiss/French polymath Johann Heinrich Lambert (Figure 9). Lambert’s cosine rule states: Eθ=E0 cosθ
where Eθ is the reduced illuminance (irradiance) at angle θ subtended by the surface normal to the direction of illumination, and E0 is the illuminance (irradiance) at normal incidence (0°).

Figure 9: Lambert’s Cosine Rule Describes the Variation of Illuminance & Irradiance with Angle
Luminance & Radiance
The fourth and final geometric property is called the radiance or luminance. These address the amount of flux emitted from a light source per unit area and per unit solid angle, usually attributed to the output of a display or sign (Figure 10). The units of radiance (radiometric) are Watts per steradian per square meter (W/sr.m2), while for luminance (photometric) we use lumens per steradian per square meter (lm/sr.m2). However, from the definition of luminous intensity, we know that a lumen per steradian is a candela, hence we can simplify the unit of luminance to candelas per square meter (cd/m2).
Figure 10: Luminance is the Flux Emitted per Unit Solid Angle per Unit Area
As with intensity, we would expect to define the direction of view when specifying the luminance of a display, however it is common for manufacturers to state a luminance value with the implied understanding that this is for viewing at normal incidence.
In display metrology, an important metric is the view angle. The view angle is defined as the maximum angle over which the display maintains a contrast ratio of >1. The contrast ratio in turn is defined as the ratio of luminance when the display is set to full white versus full black. This is illustrated below (Figure 12) which shows a display with a white luminance of 200 cd/m2, a black luminance of 2 cd/m2 and hence a contrast ratio of 200:2 (100:1).
An important consideration when testing the luminance or radiance of small lit objects is the measurement spot size. As with intensity, luminance and radiance don’t vary with the distance from the source. However, the measurement equipment is designed with a certain collection field-of-view or area (hence the term used for such instruments is “spot photometer”). Provided that the lit area of the source extends beyond the collection aperture (the aperture is said to be overfilled), the luminance meter will report an accurate value. However, if the measurement spot extends beyond the object’s lit area, the reported luminance will be erroneous.

Figure 11: Luminance Measurements of Small Objects Require Careful Choice of Photometer Field-of-View

Figure 12: The Contrast Ratio for a Display is the Ratio of White to Black State Luminance
Consider the measurement of the 100 mph symbols on a car’s speedometer (Figure 11). As shown , with the measurement spot (red dot) falling well within the lit area of the symbol, the true luminance (12 cd/m2) is reported. As the luminance meter is moved further away from the display, the measurement spot size increases to nearly the stroke width of the symbol. Edge effects in the photometer optics cause the reading to become low (8.1 cd/m2). When the measurement spot overlaps with the unlit background of the symbol, a mean luminance of the object and background will be reported (4.3 cd/m2). In conclusion, always ensure that you use a spot luminance meter with a measurement field-of-view that captures light from well within the lit area of the object under test.
Far-Field Versus Near-Field
The near-field and far-field have been mentioned earlier is relation to the measurement of intensity. To recap, in the far-field, intensity is a constant and the illuminance or irradiance from a lamp can be calculated for any distance using the inverse squared rule, provided that you remain in the far-field. Let’s now define what is meant by the far-field.
The far-field is that distance away from a light source where the beam can be considered to be “fully formed”, the source behaves as a point emitter, the intensity is a constant and the illuminance or irradiance obey the inverse squared rule. The bigger the light source, the greater the distance to the far-field. This is shown schematically below (Figure 13) which models the shape of the beam from 3 LEDs when shone onto a surface at different distances (multiples of the luminous aperture).

Figure 13: Schematic Illustrating the Formation of a Beam of Light Comprised of Three Discrete Emitters
We define a parameter called the luminous aperture (parameter “d” in Figure 13) for a light source or luminaire, this being the largest dimension of the lit area. For a circular luminaire, the luminous aperture is the diameter, for a linear source it is the length and for a square or rectangular source it is the diagonal. As a rule of thumb, the distance to the far-field (parameter “x” in Figure 13) for a diffused, wide angle source is at ≥5 times the luminous aperture of the source. As an example, for a 1.5m linear luminaire, the far-field distance will generally be at ≥7.5m, while for a 60cm ceiling luminaire, the far-field distance will be at ≥4m.
Recent standards relating to the photometry of luminaires set an even higher threshold for the far-field distance. EN13032-4 recommends a working distance of ≥10 times the luminous aperture, while for narrow angle beams of <30°, CIE S025 and EN13032-4 recommend a working distance of 15 times. If the light source is comprised of a linear array of discrete emitters (for example, an undiffused linear LED array), these standards predict the far-field distance as being ≥15 times the sum of the luminous aperture and the separation between emitters.
For the testing of vehicle lighting, UNECE regulations remove any ambiguity and simply require that headlamps be tested at 25m. This far-field distance reflects the fact that car headlamps are both narrow angle and highly structured.
To recap, one may measure the intensity and illuminance or irradiance at any distance from a light source. However, if the intention is to measure intensity and then use the inverse squared rule to calculate the illuminance or irradiance, it is vital to measure the intensity in the far-field.
Goniophotometry
No review of the theory of light measurement science would be complete without a mention of goniophotometry. The measurement of luminous intensity, illuminance or luminance from a light source as a function of angle is referred to as a goniophotometric measurement. In the case of architectural lighting and luminaires, it is essential to know how much light is emitted in all directions. This ensures that a light source is chosen that achieves the required illuminance on the reference plane, and also avoids the use of lamps that produce excessive glare. With displays, a goniophotometric measurement will yield the view angle. While for automotive headlamps, a goniophotometric measurement ensures that the product adheres to UNECE regulations for minimum road illuminance, beam shape and high beam cut-off to avoid dazzling oncoming traffic.
Summary
Radiometry is the science of measuring the absolute amount of optical radiation, whereas photometry is the science of measuring light as the human vision system would perceive it, possessing as we do a characteristic spectral sensitivity to visible light called the photopic response. As the light level dims, we transition from daylight adapted photopic vision where green light appears brightest to dark adapted scotopic vision where shorter wavelength, blue/green light appears brightest.
Geometrically, there are four parameters that one might wish to measure, being the total amount of light (radiant or luminous flux), the amount of light shining in a specified direction (the radiant or luminous intensity), the amount of light illuminating a surface at a given distance (the illuminance and irradiance) and finally the amount of light emitted from a display (the luminance or radiance).
For a complete spatial or angular characterisation of the light emitted from a light source, a goniophotometric measurement would yield the radiant or luminous intensity values as a function of angle.
Further Information
Pro-Lite specialises in supplying and renting equipment for optical radiation metrology, including radiometers, photometers, colorimeters, spectroradiometers, integrating spheres and goniophotometers. We also provide online training workshops that reviews the science and practicalities of light metrology, colorimetry and of photobiological safety measurements.